usage: atrace [options] [categories...] options include: -a appname enable app-level tracing for a comma separated list of cmdlines; * is a wildcard matching any process -b N use a trace buffer size of N KB -c trace into a circular buffer -f filename use the categories written in a file as space-separated values in a line -k fname,... trace the listed kernel functions -n ignore signals -s N sleepfor N seconds before tracing [default 0] -t N trace for N seconds [default 5] -z compress the trace dump --async_start start circular trace and return immediately --async_dump dump the current contents of circular trace buffer --async_stop stop tracing and dump the current contents of circular trace buffer --stream stream trace to stdout as it enters the trace buffer Note: this can take significant CPU time, and is best used for measuring things that are not affected by CPU performance, like pagecache usage. --list_categories list the available tracing categories -o filename write the trace to the specified file instead of stdout.
Options: -h, --help show this help message and exit -o FILE write HTML to FILE -t N, --time=N trace for N seconds -b N, --buf-size=N use a trace buffer size of N KB -k KFUNCS, --ktrace=KFUNCS specify a comma-separated list of kernel functions to trace -l, --list-categories list the available categories and exit -a APP_NAME, --app=APP_NAME enable application-level tracing for comma-separated list of app cmdlines --link-assets link to original CSS or JS resources instead of embedding them --from-file=FROM_FILE read the trace from a file (compressed) rather than running a live trace --asset-dir=ASSET_DIR -e DEVICE_SERIAL, --serial=DEVICE_SERIAL adb device serial number
usage: dumpsys
         To dump all services.
or:
       dumpsys [-t TIMEOUT] [--priority LEVEL] [--pid] [--thread] [--help | -l | --skip SERVICES | SERVICE [ARGS]]
         --help: shows this help
         -l: only list services, do not dump them
         -t TIMEOUT_SEC: TIMEOUT to use in seconds instead of default 10 seconds
         -T TIMEOUT_MS: TIMEOUT to use in milliseconds instead of default 10 seconds
         --pid: dump PID instead of usual dump
         --thread: dump thread usage instead of usual dump
         --proto: filter services that support dumping data in proto format. Dumps
               will be in proto format.
         --priority LEVEL: filter services based on specified priority
               LEVEL must be one of CRITICAL | HIGH | NORMAL
         --skip SERVICES: dumps all services but SERVICES (comma-separated list)
         SERVICE [ARGS]: dumps only service SERVICE, optionally passing ARGS to it
Usage: simpleperf [common options] subcommand [args_for_subcommand] common options: -h/--help Print this help information. --log <severity> Set the minimum severity of logging. Possible severities include verbose, debug, warning, info, error, fatal. Default is info. --log-to-android-buffer Write log to android log buffer instead of stderr. --version Print version of simpleperf. subcommands: api-collect Collect recording data generated by app api api-prepare Prepare recording via app api debug-unwind Debug/test offline unwinding. dump dump perf record file helpprinthelp information for simpleperf inject parse etm instruction tracing data kmem collect kernel memory allocation information list list available event types merge merge multiple perf.data into one monitor monitor events and print their textual representations to stdout record record sampling info in perf.data report report sampling information in perf.data report-sample report raw sample information in perf.data stat gather performance counter information trace-sched Trace system-wide process runtime events.
# Stat using default events (cpu-cycles,instructions,...), and monitor process 7394 for 10 seconds. $ simpleperf stat -p 7394 --duration 10 Performance counter statistics:
Usage: perfetto
  --background     -d      : Exits immediately and continues tracing in
                            background
  --config         -c      : /path/to/trace/config/file or - for stdin
  --out            -o      : /path/to/out/trace/file or - for stdout
  --upload                 : Upload field trace (Android only)
  --dropbox        TAG     : DEPRECATED: Use --upload instead
                            TAG should always be set to 'perfetto'
  --no-guardrails          : Ignore guardrails triggered when using --upload
                            (for testing).
  --txt                    : Parse config as pbtxt. Not for production use.
                            Not a stable API.
  --reset-guardrails       : Resets the state of the guardails and exits
                            (for testing).
  --query                  : Queries the service state and prints it as
                            human-readable text.
  --query-raw              : Like --query, but prints raw proto-encoded bytes
                            of tracing_service_state.proto.
  --save-for-bugreport     : If a trace with bugreport_score > 0 is running, it
                            saves it into a file. Outputs the path when done.
  --help           -h


light configuration flags: (only when NOT using -c/--config)
  --time           -t      : Trace duration N[s,m,h] (default: 10s)
  --buffer         -b      : Ring buffer size N[mb,gb] (default: 32mb)
  --size           -s      : Max file size N[mb,gb] (default: in-memory ring-buffer only)
  --app            -a      : Android (atrace) app name
  ATRACE_CAT               : Record ATRACE_CAT (e.g. wm)
  FTRACE_GROUP/FTRACE_NAME : Record ftrace event (e.g. sched/sched_switch)

statsd-specific flags:
  --alert-id           : ID of the alert that triggered this trace.
  --config-id          : ID of the triggering config.
  --config-uid         : UID of app which registered the config.
  --subscription-id    : ID of the subscription that triggered this trace.

Detach mode. DISCOURAGED, read https://perfetto.dev/docs/concepts/detached-mode :
  --detach=key          : Detach from the tracing session with the given key.
  --attach=key [--stop] : Re-attach to the session (optionally stop tracing once reattached).
  --is_detached=key     : Check if the session can be re-attached (0:Yes, 2:No, 1:Error).
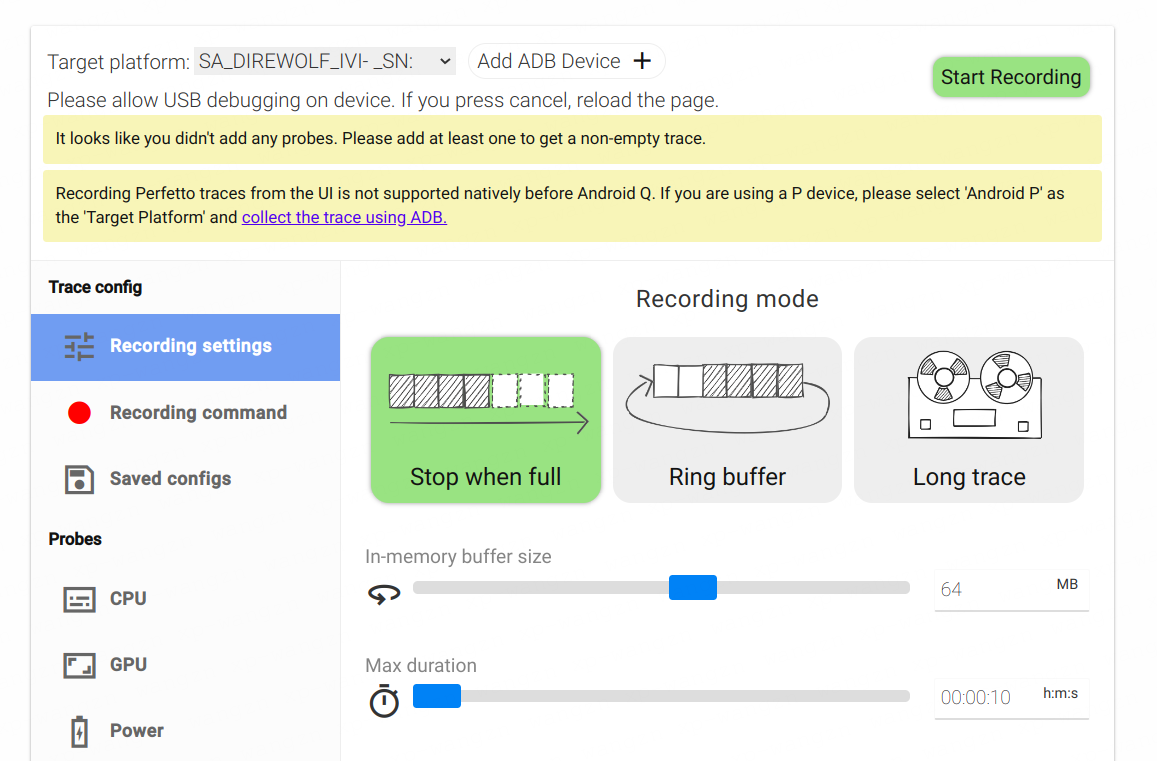
在AOSP源码目录external/perfetto/test/configs下面提供了很多perfetto的配置文件可以参考。除了使用Android系统自带的perfetto工具抓取Trace之外,还可以用网页版的perfetto工具抓取: 点击Record new trace,会弹出一个页面,可以选择抓取CPU、GPU、Memory以及APP与服务的Trace日志: